Quick introduction
wsipre has two main modules (see Module Index for docs):
slide: load and process WSIsshow: visualize images generated usingslide
The following quick intro illustrates basic usage of these modules. First, load packages (Matplotlib is only used here to plot images with no annotation).
>>> from matplotlib import pyplot as plt
>>> from wsipre import slide, show
Load WSI form the CAMELYON challenge with its region-level tumor annotation.
>>> wsi = slide.Slide(filename='patient_012_node_0.tif',
...                   annotation_filename='patient_012_node_0.xml',
...                   xml_style='asap')
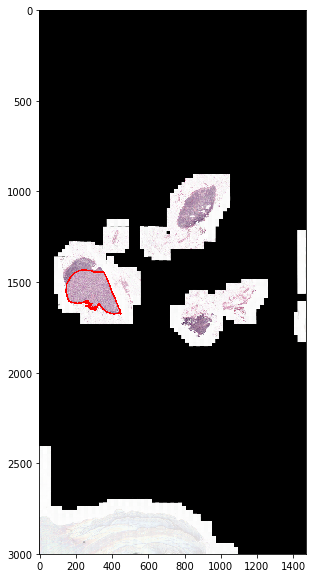
Generate and show a thumbnail.
>>> thumbnail, mask, downsampling_factor = wsi.get_thumbnail_with_annotation(
...     size=(3000, 3000), polygon_type='line', line_thickness=8)

>>> black = (0, 0, 0)
>>> red = (1, 0, 0)
>>> yellow = (1, 1, 0)
>>> colors = {0: black, 1: black, 2: red}

>>> fig = show.Figure(image=thumbnail, annotation=mask, color_map=colors)
>>> fig.show_image_with_annotation(split=False)
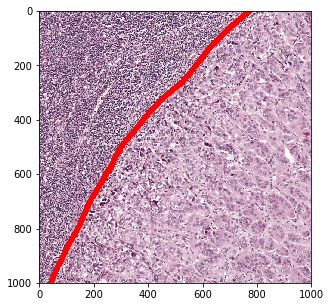
Zoom in and read a smaller region from the WSI.
>>> loc = (int(150*downsampling_factor), int(1450*downsampling_factor))

>>> slide_region, mask_region = wsi.read_region_with_annotation(
...      location=loc, level=2, size=(1000, 1000), polygon_type='line',
...      line_thickness=20)

>>> fig = show.Figure(
...     image=slide_region, annotation=mask_region, color_map=colors)
>>> fig.show_image_with_annotation(split=False)
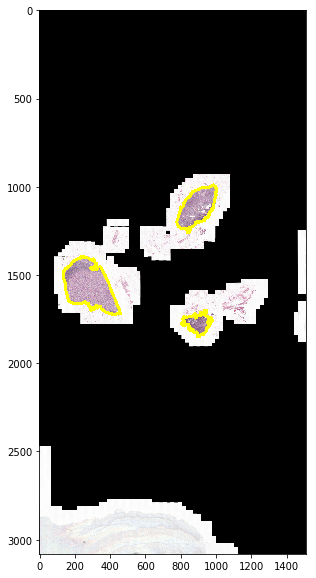
Locate tissue regions in the WSI automatically.
>>> wsi.get_tissue_mask(polygon_type='line', line_thickness=15)
Slide('patient_012_node_0.tif')

>>> fig = show.Figure(image=wsi.downsampled_slide,
...                   annotation=wsi.tissue_mask,
...                   color_map={0: black, 1: yellow})
>>> fig.show_image_with_annotation(split=False)
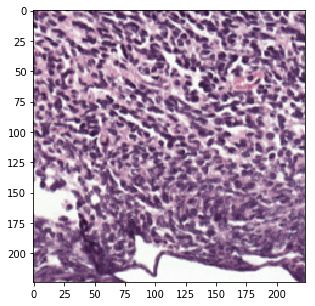
Sample a random patch from tissue regions.
>>> tissue_patch = wsi.read_random_tissue_patch(level=2, size=(224, 224),
...                                             avoid_labels=[2])
>>> plt.imshow(tissue_patch)
>>> plt.show()
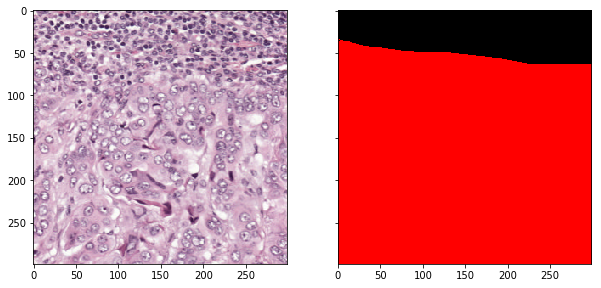
Sample a random patch from regions annotated as tumor (label 2).
>>> slide_region, mask_region = wsi.read_random_patch(
...     level=2, size=(299, 299), target_class=2,
...     min_class_area_ratio=0.75, polygon_type='area')

>>> fig = show.Figure(slide_region, mask_region, {0: black, 2:red})

>>> fig.show_image_with_annotation(split=True)
Double check the mapping between class label and color.
>>> fig.show_label_colors()